Visualising the ATI portfolio: a step change featuring SharpCloud
How do you visualise and interrogate a portfolio as vast as the ATI’s? In this blog, Nikul Bhadasia explains how the ATI worked with SharpCloud to showcase its portfolio of R&T projects.
When the ATI Programme portfolio began to approach 300 projects, we identified a need to showcase the value being delivered through the ATI Programme. We took advantage of the ATI’s website refresh to improve how we do this. Just as the website was updated to better showcase the ATI as an organisation, the development of our project portfolio story is a step change in how we demonstrate our impact.
Although we regularly published statistics on our website, they only provided a high-level status. We needed a tool to help visualise and manage the ATI’s portfolio of R&T projects, which would enable deeper discovery of the partnerships, technologies and economics.
We had already used SharpCloud software to map European programme engagement, though not to the level of detail required by a body of information such as the ATI Programme portfolio. We worked closely with the SharpCloud team to develop what’s known as a ‘story’ – a data framework that would clearly display our portfolio and enable much deeper interrogation of the statistics. The story is more than just a database – it helps us to explain, map and tell the individual stories of ATI-supported projects which are helping to drive UK innovation, technology and competitiveness.
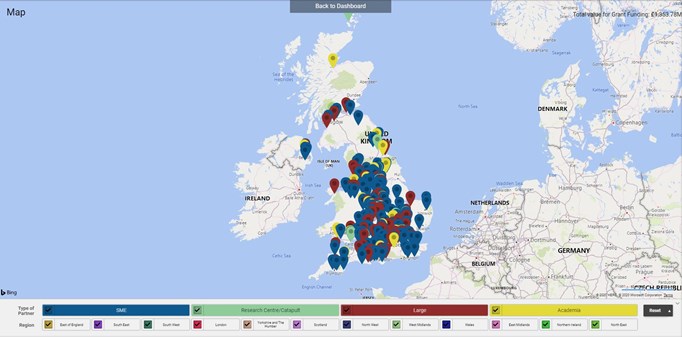
The project partner map view – our partner footprint
Interactivity was a key driver for choosing SharpCloud. When users enter the story, they can customise their view of the data by using filters and charts to display the data most valuable to them. This generates more detailed insights than the standard model which displays a static view. Key benefits of being able to generate custom views are:
- Geographical mapping of our growing 330+ UK project partners – this shows the diverse regional spread as well as the size of the organisation
- Thematic views of our portfolio via funding stream or specific technologies
- Views of specific partners and their associated projects
- Instant access anywhere on desktop or mobile device
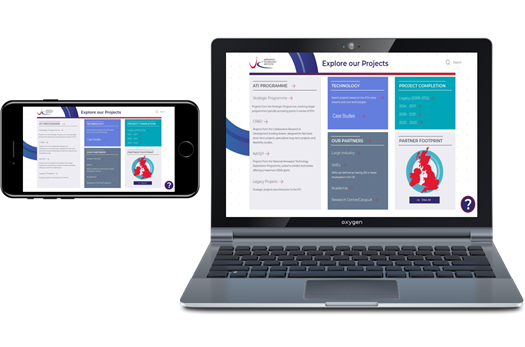
The story also allows us to include case studies, videos and other media associated with each project. This provides a simplified way to access information on the projects without having to navigate through many layers of webpages, as in the previous system.
SharpCloud also worked with us to develop brand new features which would help us to get more value from the data. A key example was a user analytics tracker which, when linked with our website analytics, provides the capability to gain insight into which areas are being explored regularly.
The ATI project portfolio story is open access for anyone to delve into the projects across our portfolio. We have created some custom views which we think will be the most relevant and useful – such as regional footprint, project by technology priority area, and by funding stream. We encourage you to explore the dashboard and utilise the various views available – or customise your own!
Any database is only as good as the data that goes into it – thanks goes to the ATI team who provided the data that enabled this project.
ATI Project Portfolio – dive straight into our SharpCloud story and explore our projects.
If you have any queries relating to the portfolio visualisation, please connect with us via info@ati.org.uk